Customizing the Shape and Color of Mean Marker in Seaborn Boxplots
You can use the boxplot function from seaborn python package to plot the boxplot.
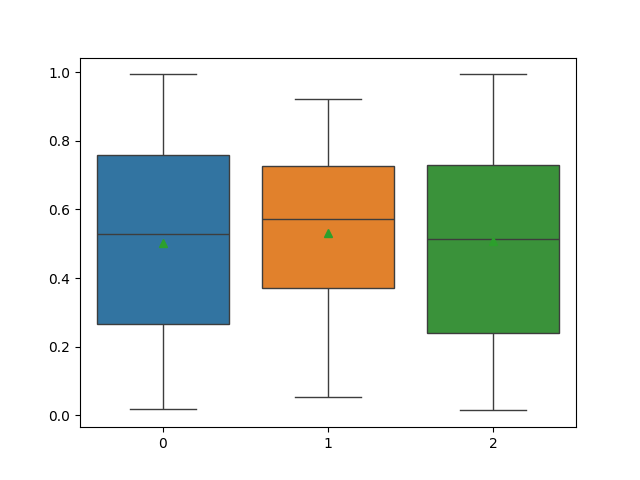
You can show the mean on the seaborn boxplot using the showmeans=True parameter. By default, it shows the mean by
a green triangle marker.
You can adjust the shape, size, and color of the mean marker on seaborn boxplot using the meanprops parameter.
The following example explains how to customize the shape and color of the mean marker on seaborn boxplot.
Let’s create a random dataset for three groups using the rand function from NumPy,
# import packages
import numpy as np

data = np.random.rand(50, 3)
We have created the pandas DataFrame with three variables.
Plot the the boxplot using the boxplot function from seaborn and show the mean with the showmeans parameter,
# import package
import seaborn as sns
import matplotlib.pyplot as plt

# plot boxplot
sns.boxplot(data=data, showmeans=True)

plt.show()

In the above figure, we have generated a boxplot and displayed the mean of each variable by a green triangle.
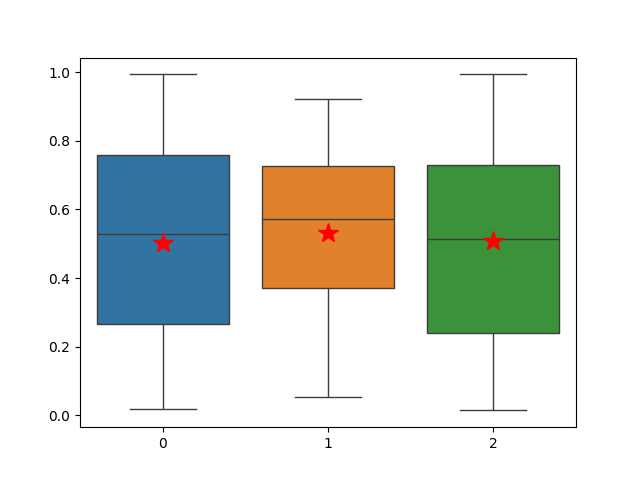
You can change the color, shape, and size of the mean marker using the meanprops parameter in seaborn.
# import package
import seaborn as sns
import matplotlib.pyplot as plt

# plot boxplot and change color and shape of the mean marker
sns.boxplot(data=data, showmeans=True,
	meanprops=({"marker":"*",
				"markerfacecolor":"red",
				"markeredgecolor": "red",
				"markersize":15}))

plt.show()

You can see that we have generated a boxplot and displayed the mean of each variable by a red star.
Based on your requirement, you can change the shape, size, and color of the marker using the meanprops parameter in seaborn.