How to Adjust Spacing in pandas Histograms
In pandas, you can use the hist() function for plotting the histogram.
When you plot multiple histograms in a single plot, you may notice that the default spacing between multiple histograms can make your histograms appear cluttered.
You can use figsize and tight_layout functions from the matplotlib to adjust the space between histograms and avoid cluttering.
The following example explains how to adjust the spacing between pandas histograms.
Create a sample DataFrame,
# import package
import pandas as pd
import numpy as np

# create DataFrame
df = pd.DataFrame(np.random.randn(2000).reshape(100,20), columns=list('ABCDEFGHIJKLMNOPQRST'))
We have created the pandas DataFrame with 10 variables.
Plot the 10 histograms in a single plot using the hist() function from pandas.
# import package
import matplotlib.pyplot as plt
import pandas as pd

# plot multiple histograms
df.hist(sharex=True, sharey=True)
plt.show()

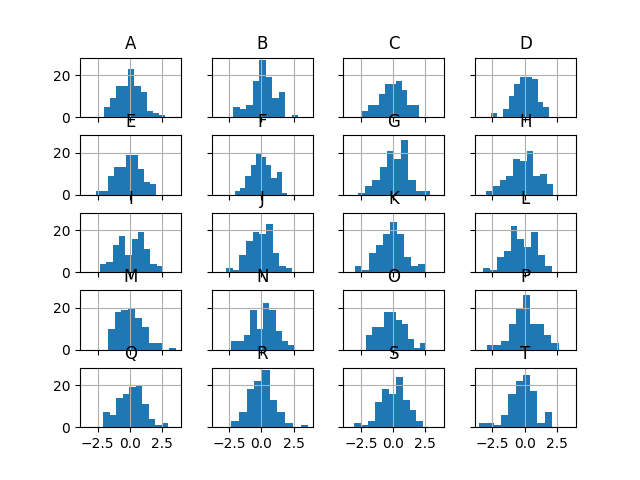
In the above figure, we have generated 20 histograms in a single plot.
By default, pandas hist() function creates subplots with minimal spacing, making the subplots (individual histograms) appear too close to each other.
But, you can use figsize and tight_layout functions to add more spacing between the individual histograms in pandas.
# import package
import matplotlib.pyplot as plt
import pandas as pd

# plot multiple histograms
df.hist(sharex=True, sharey=True, figsize=(8,6))
plt.tight_layout()
plt.show()

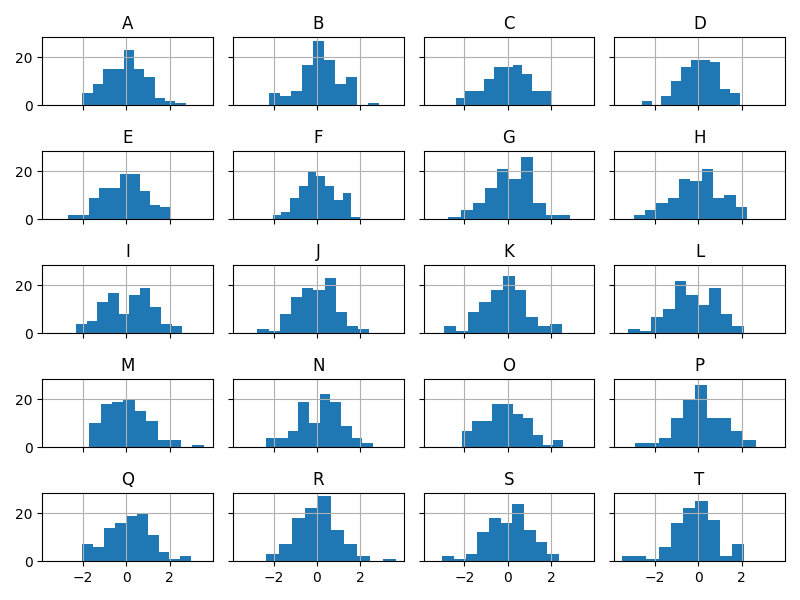
You can see that we have generated multiple pandas histograms with more spacing. The tight_layout function automatically adjusts the padding between and around subplots.
In addition, you can also adjust the plot size using the figsize parameter.
This will give you more clearer and readable histograms.