How to Add Title to Collection of pandas Histograms
In pandas, you can use the hist() function for plotting the histogram.
Sometimes, it could be tricky to add the global title at the top of the collection of histograms when you plot them in a single plot.
You can use the suptitle() function from matplotlib to add the centered global title to the collection of pandas histogram.
The following example explains how to plot multiple histograms using pandas hist() function and add a global title
at the top of these histograms using the suptitle() function.
Create a sample DataFrame,
# import package
import pandas as pd
import numpy as np

# create DataFrame
df = pd.DataFrame(np.random.randn(400).reshape(100,4), columns=list('ABCD'))

# view DataFrame
df.head()

# output
          A         B         C         D
0 -1.477530 -0.599802 -2.218447 -1.925065
1 -0.652851  2.242183 -2.173248  2.447870
2  1.387551 -1.182705 -2.229145  0.282596
3  1.976779 -1.393013  0.122648  0.422761
4  0.017421 -0.059897 -0.525809  1.048065
We have created the pandas DataFrame with four variables.
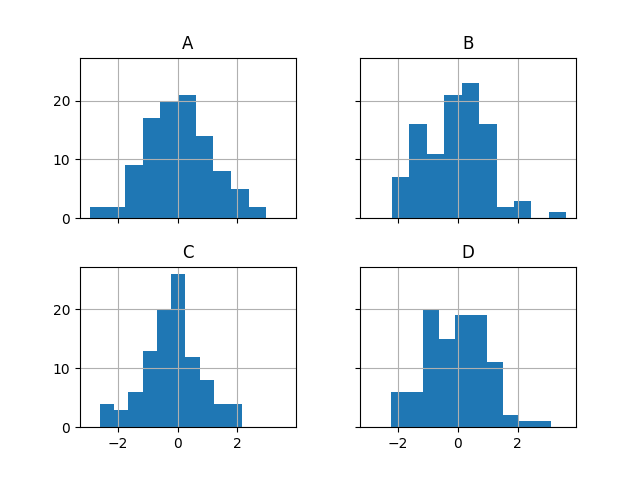
Plot the four histograms using the hist() function from pandas.
# import package
import matplotlib.pyplot as plt
import pandas as pd

# plot multiple histograms
df.hist(sharex=True, sharey=True)
plt.show()

In the figure, we have generated four histograms in a single plot.
Now, you can use the suptitle() function from matplotlib to add the centered global title to the collection of pandas histogram.
# import package
import matplotlib.pyplot as plt
import pandas as pd

# plot multiple histograms
df.hist(sharex=True, sharey=True)
# add title
plt.suptitle("Four histograms")
plt.show()

You can see that we have generated the collection of pandas histogram in a single plot and added the centered global title at the top of these histograms.
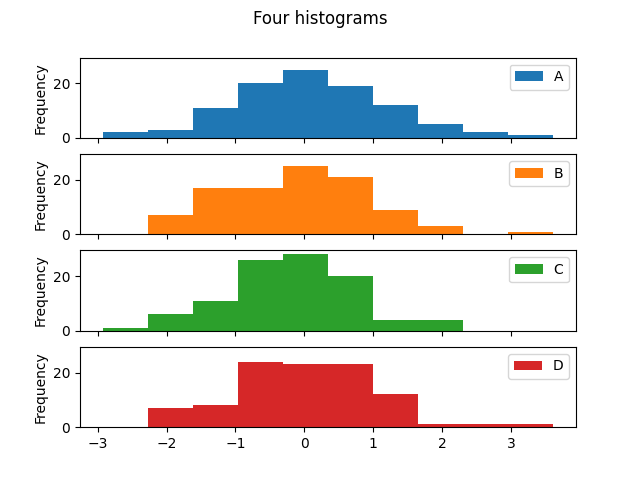
In addition to the hist function, you can also use the plot function from pandas to generate a collection of pandas histograms in a single plot and add the title at the top.
# import package
import matplotlib.pyplot as plt
import pandas as pd

df.plot(kind='hist',subplots=True,sharex=True,sharey=True,title='Four histograms')
