Pandas DataFrame Scatter Plots

A scatterplot is useful for plotting the relationship between the two continuous variables as data points on a two-dimensional graph.
Scatterplots are useful for identifying patterns, clusters, and trends among variables.
In Pandas, you can create a scatterplot from a DataFrame using the DataFrame.plot.scatter function.
The basic syntax for DataFrame.plot.scatter for creating a scatterplot:
# load package
import pandas as pd

# create scatterplot
df.plot.scatter(x='col1', y='col2', c='red', s=2)
Where,
| parameter | description |
|---|---|
x |
The column name for x-axis |
y |
The column name for y-axis |
c |
Color |
s |
data point size |
The following examples illustrate how to create beautiful scatterplots using Pandas.
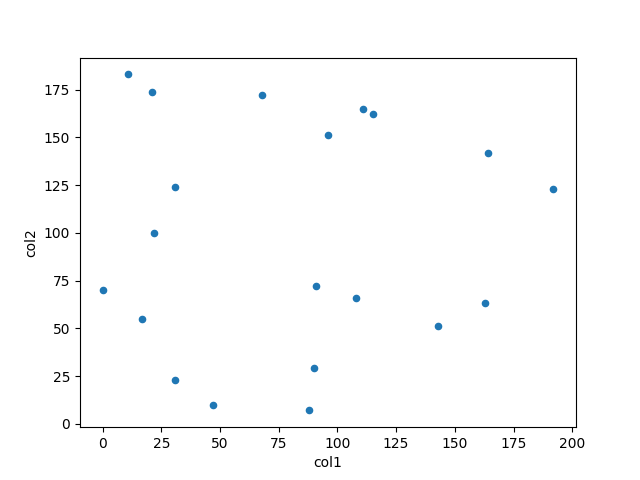
1 Default scatterplot
We will create a random Pandas DataFrame for creating scatterplots
# load package
import pandas as pd
import numpy as np

# create random dataframe
df = pd.DataFrame(np.random.randint(0,200,size=(20, 2)),
                  columns=['col1', 'col2'])

# view first two rows
df.head(2)

   col1  col2
0   115   162
1    11   183
Create default scatterplot,
# load package
import pandas as pd
import matplotlib.pyplot as plt

# create scatterplot
df.plot.scatter(x='col1', y='col2')
plt.show()
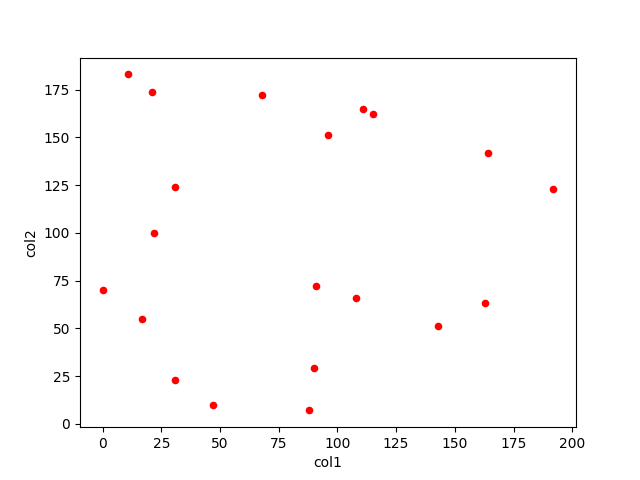
2 Change the color and size
You can change the color and size of the Pandas scatterplot using c and s parameters.
# load package
import pandas as pd
import matplotlib.pyplot as plt

# create scatterplot with change color and point size
df.plot.scatter(x='col1', y='col2', c='red', s=20)
plt.show()

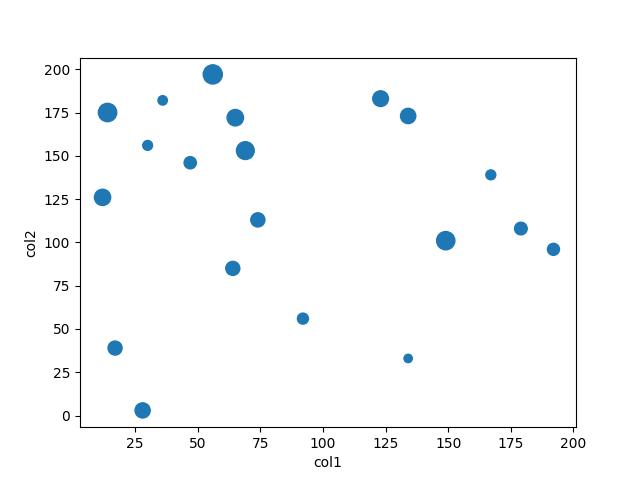
3 Variable point size
You can also add the variable point size based on the specific column to Pandas scatterplot.
# load package
import pandas as pd
import matplotlib.pyplot as plt

# create random pandas dataframe
df = pd.DataFrame(np.random.randint(0,200,size=(20, 3)),
                  columns=['col1', 'col2', 'col3'])

# create scatterplot with point size based on col3
df.plot.scatter(x='col1', y='col2', s='col3')
plt.show()

4 Add a colormap
You can also add the colormaps to Pandas scatterplot. You need an additional categorical variable to specify the colormap.
# load package
import pandas as pd
import matplotlib.pyplot as plt

# create random pandas dataframe
df = pd.DataFrame([[10, 20, 15, 1], [5, 6, 7, 1], [25, 30, 35, 0],
                   [6, 7, 9, 1], [12, 15, 16, 0]])
df.columns = ['col1', 'col2', 'col3', 'col4']

# create scatterplot with colormap based on col4
df.plot.scatter(x='col1', y='col2', c='col4', colormap='cividis')
plt.show()

DataFrame.plot
to customize the Pandas scatterplot.