How to Implement k-Nearest Neighbors (kNN) in Python

1 kNN background
k-Nearest Neighbors (kNN) is a supervised machine learning algorithm widely used for classification and regression analysis.
The kNN algorithm uses the rule of majority for classification and the average of nearest neighbors’ values for regression.
The variable parameter (k), also known as nearest neighbours is a crucial parameter in kNN. An appropriate value
of k is crucial; a small value may be sensitive to noise, whereas a large value may smooth out patterns.
Based on distance measures such as Euclidean distance, the kNN determines k nearest data points and applies the majority rule to classify them.
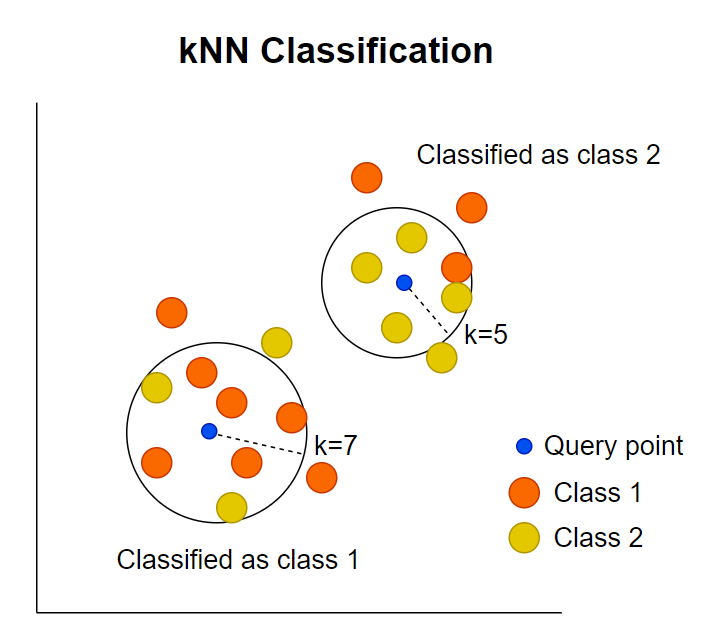
The kNN algorithm is illustrated in the following figure. Using k=7, the kNN identifies the 7 closest data points from the query point. Among the 7 points identified, 5 are classified as class 1 and 2 as class 2. According to the majority rule, the 7 points fall into class 1.
2 Implement kNN in Python
2.1 Requirements
You need to install scikit-learn (sklearn), and matplotlib Python packages for implementing and visualizing the
kNN.
2.2 Generate a sample dataset
We will generate a random dataset with two features and three classes using the make_blobs function from the sklearn
package.
# load packages
from sklearn.datasets import make_blobs

# generate random dataset
data, classes = make_blobs(n_samples=300, n_features=2,
                              centers=3, cluster_std=0.5,
                              random_state=0)
# check data dimensions
data.shape
(300, 2)

classes.shape
(300,)
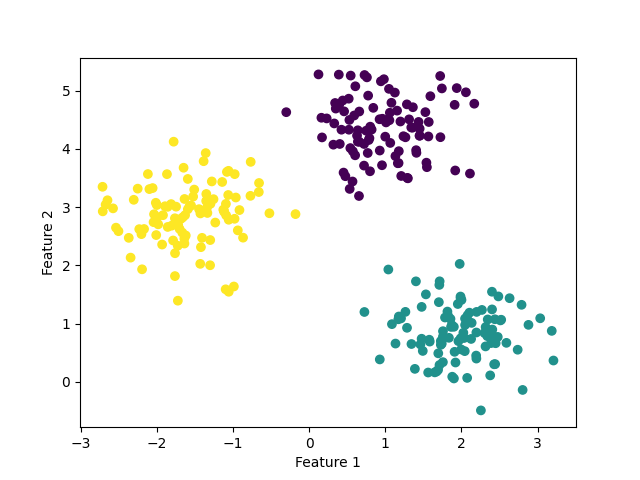
If you visualize this dataset as a scatterplot, you should see three different clusters (classes).
# load packages
import matplotlib.pyplot as plt

plt.scatter(data[:,0], data[:,1], c=classes)
plt.xlabel("Feature 1")
plt.ylabel("Feature 2")
plt.show()
2.3 Training and testing split
The training and testing splitting of the dataset is essential for the kNN algorithm. The training dataset will be used for fitting the kNN model and the subsequent model will be used for performance evaluation using the testing dataset.
In addition, the training dataset is also helpful for the hyperparameter tuning of the k parameter and selecting the
best k value for the best generalization to test data.
We will use the train_test_split function from sklearn to split the dataset into 80% training and 20% testing. You can
change this proportion as per your requirements.
# load packages
from sklearn.model_selection import train_test_split

# split dataset
X_train, X_test, y_train, y_test = train_test_split(data, classes,
                                                    test_size=0.2,
                                                    random_state=12)
2.4 Fit the kNN classifier model
You can fit the kNN model in Python using the KNeighborsClassifier function from the sklearn package. This function
needs the number of neighbors hyperparameter (n_neighbors or k) for fitting the kNN classification model.
The hyperparameter k is a critical for building an efficient kNN model. A common rule of thumb is to choose
k as the square root of the number of data points in your dataset. For example, if the training dataset has 240 data points,
then we should set k = 15.
# load packages
from sklearn.neighbors import KNeighborsClassifier

# initialize kNN classifier
knn_model = KNeighborsClassifier(n_neighbors=15)
# fit the model on training dataset
knn_model.fit(X_train, y_train)
2.5 Perform predictions
Once you have fitted the kNN model using the training dataset, the fitted kNN model can be used for performing prediction on unseen testing data.
You can use the predict method to perform prediction using a fitted model.
# perform prediction on testing dataset
pred = knn_model.predict(X_test)
2.6 Evaluate the accuracy of the kNN model
The accuracy of the fitted kNN model can be calculated using the accuracy_score function from sklearn. It represents the
proportion of correctly classified classes among the total classes in the test dataset.
The predicted classes are compared to the true classes to calculate accuracy.
# load package
from sklearn.metrics import accuracy_score

accuracy = accuracy_score(y_test, pred)
print(accuracy)
1.0
The accuracy of the fitted kNN model is 1.0 (or 100%). It means that the fitted model is a perfect classifier
2.7 Visualize kNN predicted classification
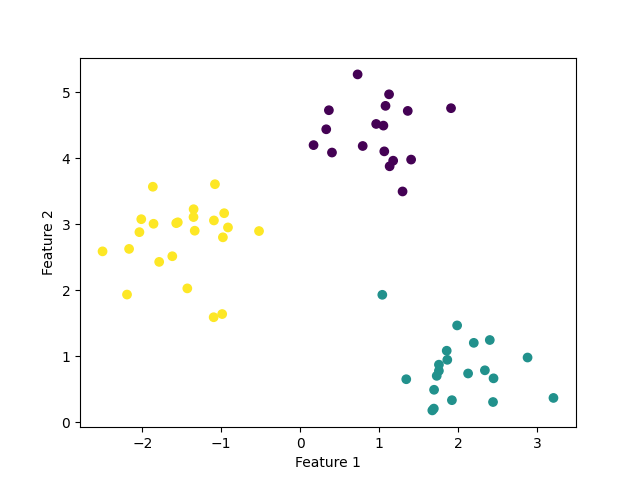
The visualization of the predicted classification is useful in understanding how the kNN classified new data points based on the fitted model.
# load package
import matplotlib.pyplot as plt

plt.scatter(X_test[:,0], X_test[:,1], c=pred)
plt.xlabel("Feature 1")
plt.ylabel("Feature 2")
plt.show()


