How to Conduct Welch's t-test in R

1. Welch’s t-test
Welch’s t-test is a statistical method used in comparing the means of two independent groups when the assumption of equal variance between the two groups is violated.
Welch’s t-test extends the traditional two-sample t-test and is specifically designed for situations where we cannot assume equal variances between the two groups being compared.
In R, you can perform Welch’s t-test using the t.test function from base R. The basic syntax of this function is as
follows:
t.test(x, y, alternative = c("two.sided", "less", "greater"),
       var.equal = False)
Where,
| parameter | description |
|---|---|
x |
A numeric vector for first group |
y |
A numeric vector for second group |
alternative |
Specify the alternative hypothesis for the test. The default value is two.sided |
var.equal |
Whether to treat the two group variances as being equal. The default value is False. |
The following example illustrates how to perform Welch’s t-test in R with an example dataset.
2. Welch’s t-test hypothesis
Null Hypothesis (H0): Means of the two groups are equal
Alternative Hypothesis (H1): Means of the two groups are not equal
3. Perform Welch’s t-test R
We will use the base R t.test function to perform Welch’s t-test.
3.1 Sample dataset
Suppose we measure patients’ blood pressure after receiving two treatments (drug and placebo).
We want to check whether the drug significantly affects blood pressure compared to patients receiving placebo treatment.
drug_group <- c(88, 89, 82, 87, 120, 135, 120, 89, 95, 85)
placebo_group <- c(88, 81, 88, 86, 90, 85, 86, 86, 88, 85)
3.2 Test hypothesis
Our objective is to test the Null hypothesis whether the mean of blood pressure in two groups (drug and placebo) is the same against the alternative hypothesis that they differ significantly.
Null Hypothesis (H0): Means of blood pressure of the two groups are equal
Alternative Hypothesis (H1): Means of blood pressure of the two groups are not equal (two-sided)
3.3 Assumption of equal variances
Before performing the Welch’s t-test, it is necessary to check the assumption of equality of variances between the two groups.
To check the assumption of equality of variances, you can either use the Bartlett test or visualize the group means using the boxplot.
Let’s perform the Bartlett test,
# Combine the data into a data frame
data <- data.frame(values = c(drug_group, placebo_group),
                   group = rep(c("drug", "placebo"), each = 10))

# perform Bartlett test
bartlett.test(values ~ group, data = data)

	Bartlett test of homogeneity of variances

data:  values by group
Bartlett's K-squared = 23.108, df = 1, p-value = 1.531e-06
As the p value obtained from the Bartlett test is less than the significance level (0.05), we can reject the null hypothesis of equal variance.
In addition, you can also use a boxplot to visualize the equality of variances. You can check the spread of the data to conclude the equality of variances.
# create boxplot
boxplot(drug_group, placebo_group, names = c("Drug", "Placebo"),
        ylab = "BP")
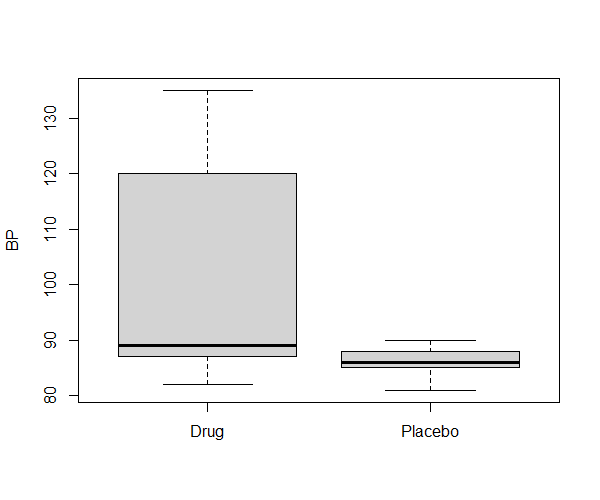
The boxpot clearly shows that the spread of the data is highly different for the drug group than the placebo group.
Hence, based on the Bartlett test and boxplot, we can assume that the variances are not equal in the two groups.
As the variances are not equal, we should perform Welch’s t-test to compare the means of blood pressure for the drug and placebo groups.
3.4 Perform Welch’s t-test
Let’s perform the Welch’s t-test,
t.test(drug_group, placebo_group)

	Welch Two Sample t-test

data:  drug_group and placebo_group
t = 2.1305, df = 9.3096, p-value = 0.06097
alternative hypothesis: true difference in means is not equal to 0
95 percent confidence interval:
 -0.7168337 26.1168337
sample estimates:
mean of x mean of y
     99.0      86.3
The p value and t statistics obtained from Welch’s t-test are 0.0609 and 2.1305, respectively.
As the p value is non-significant (p > 0.05), we fail to reject the null hypothesis that the group means are equal.
We can conclude that the blood pressure measurements in drug (mean = 99) and placebo (mean = 86.3) treatments are not significantly different.
The 95% confidence interval for treatment differences is (-0.71, 26.11). This indicates that we are 95% confident that the true difference in blood pressure between the drug and placebo groups is between -0.71 and 26.11.