How to Choose Optimal Hyperparameters for DBSCAN

DBSCAN (Density-Based Spatial Clustering of Applications with Noise) has two main hyperparameters:
eps (epsilon) and MinPts (minimum number of points).
The eps parameter defines the radius for searching the neighboring points within a cluster, whereas
MinPts defines the minimum number of points required to form a core point (dense regions). A core point
has at least minPts data points within a eps radius.
This article describes the rules and methods for choosing the optimal values for MinPts and eps
for forming the clusters.
Choosing MinPts
The MinPts parameter is crucial in DBSCAN as it determines the minimum number of points required to
form a dense regions and clusters.
There is no pre-defined rule or method to determine MinPts for the DBSCAN. The following rules might
help to determine the appropriate MinPts for the DBSCAN.
- The
MinPtsshould be equal to or larger than the the dimensionality of the dataset. For example, if you have four features, theMinPtsshould be equal to or greater than the four. - Sometimes, you should also try setting the
MinPts= 2*dimensionality. For example, if you have two features, theMinPtsshould be 4. This is a good rule of thumb and a starting point for initiating DBSCAN clustering. - The larger values for the
MinPtscould be necessary if the dataset is noisy and larger. - If you set a lower value such as 1 or 2 for
MinPts, it may not be useful for forming meaningful clusters. - You can also visualize the clusters with different values of
MinPtsand then selectMinPtswhich gives the best clustering result.
MinPts could be challenging. Domain knowledge
is often required to set optimum value for theMinPts. The above rules are good starting
points for initiating the DBSCAN clustering and work in most of cases.Choosing eps
To compute the optimal value for eps, you can use the k-nearest neighbor (kNN) distances method. In this method,
we compute the average distance of each data point to the k-nearest neighbor.
Intitally, you will need to provide the value for the number of neighbors, which can be the same as the
MinPts.
The following examples illustrates how to estimae the eps.
# import package
from sklearn.neighbors import NearestNeighbors
import numpy as np
import matplotlib.pyplot as plt


# create random dataset with 2 features
X = np.random.randn(500, 2)
Compute the k-nearest neighbors (calculate distance of points to its k-th nearest neighbor).
# initialize the value of k for kNN which can be same as MinPts
k = 4

# Compute k-nearest neighbors
# you need to add 1 to k as this function also return
# distance to itself (first column is zero)
nbrs = NearestNeighbors(n_neighbors=k+1).fit(X)

# get distances
dist, ind = nbrs.kneighbors(X)
Drop first column (which is zero) and sort the distances in ascending order,
k_dist = np.sort(dist[:, -1])
Plot the kNN graph with sorted distance,
plt.plot(k_dist)
plt.xlabel('Distance sorted points')
plt.ylabel(f'{k}-Distance')
plt.show()
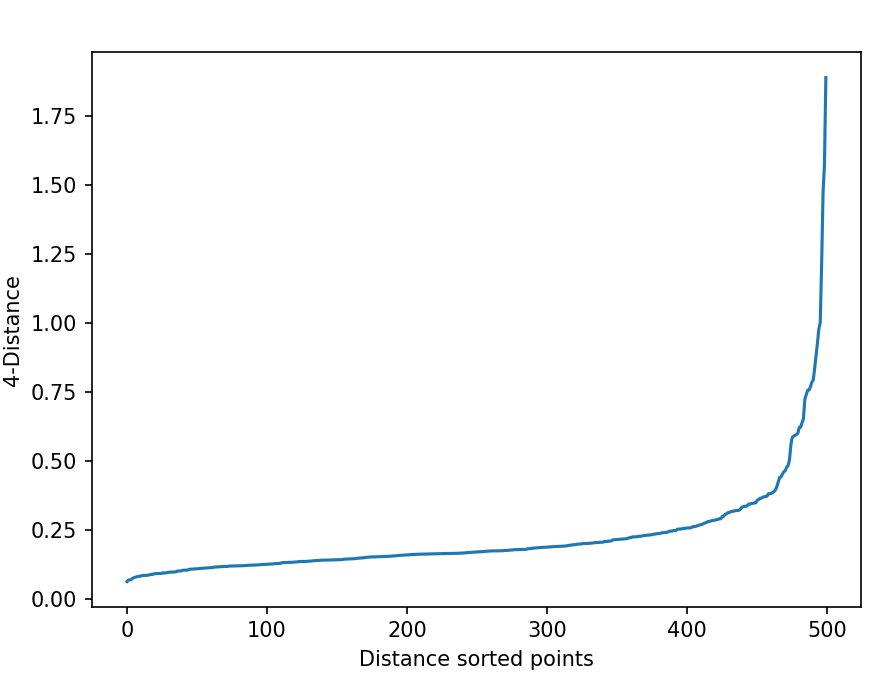
In the above kNN distance plot, you can find the optimal value of eps by looking at the “knee” or “elbow” point (where there is significant change) in the kNN curve. You can see
that there is a knee at 0.25 and indicates a good value for the eps.
This eps point indicates a natural threshold for distinguishing between cluster points and noise points in the dataset.
It can sometimes be difficult to visually identify the ideal value for eps. For such cases, you should evaluate the values within a certain range
where there is a significant change, and run DBSCAN with different eps values within that range to determine the optimal eps value.
Additionally, you can also use automatic methods to identify the eps value from the kNN graph.