How to Show Mean and Standard Error on Boxplot in R
Boxplots are a great way to visualize the distribution (min, max, quartiles, and median) of a dataset. However, they do not display the mean and standard error of the dataset by default.
In R, you can use the ggplot2 package to add mean and standard error on the boxplot.
The following example explains how to add mean and standard error on a boxplot using the ggplot2 package in R.
We will use the built-in mtcars data. This dataset contains the 11 variables for various observations of car models.
data('mtcars')

# view data frame
head(mtcars)
                  mpg cyl disp  hp drat    wt  qsec vs am gear carb
Mazda RX4         21.0   6  160 110 3.90 2.620 16.46  0  1    4    4
Mazda RX4 Wag     21.0   6  160 110 3.90 2.875 17.02  0  1    4    4
Datsun 710        22.8   4  108  93 3.85 2.320 18.61  1  1    4    1
Hornet 4 Drive    21.4   6  258 110 3.08 3.215 19.44  1  0    3    1
Hornet Sportabout 18.7   8  360 175 3.15 3.440 17.02  0  0    3    2
Valiant           18.1   6  225 105 2.76 3.460 20.22  1  0    3    1
We will use cyl as a grouping variable to create the boxplot based on mpg variable.
Plot the boxplot using the ggplot function from the ggplot2 package,
# load packages
library(ggplot2)

ggplot(mtcars, aes(x = factor(cyl), y = mpg)) + geom_boxplot()
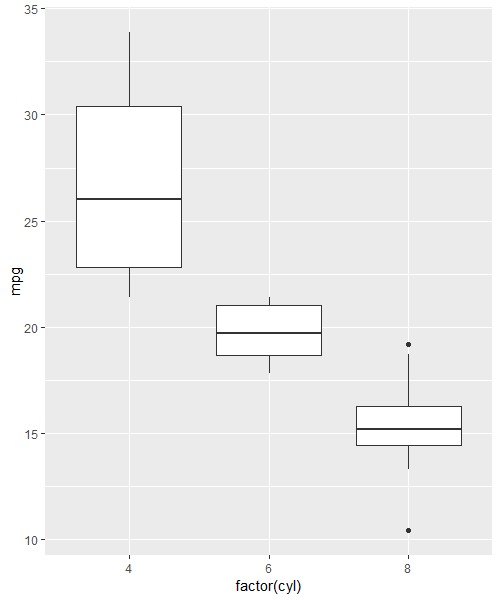
By default, the ggplot2 displays the median (thick black line on the box) of the dataset instead of the mean. In addition, it does not
add standard error to the boxplot.
If you want to add mean and standard error to the boxplot, you need to use the stat_summary function with the ggplot function.
You can use the point and errorbar for plotting mean and standard error on the boxplot, respectively.
# load packages
library(ggplot2)

ggplot(mtcars, aes(x=factor(cyl), y=mpg)) +
  geom_boxplot() +
  stat_summary(fun=mean, geom="point", shape=23, size=4, fill="red") +
  stat_summary(fun.data=mean_se, geom="errorbar", color="blue")
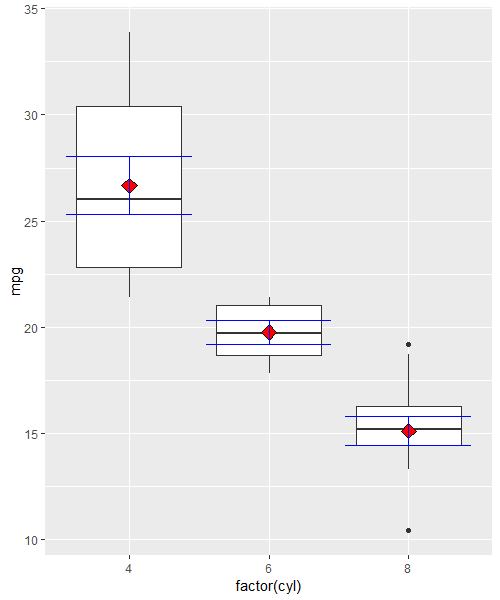
In the above boxplot, the red dot indicates the mean, and the blue vertical lines indicate the standard errors for each group in cyl variable.