Remove Median Line From Boxplot in Matplotlib
Boxplots are a great way to visualize the distribution (min, max, quartiles, and median) of a dataset.
In Python, you can generate a boxplot using the boxplot function from matplotlib. By default, the boxplot displays the median line on the boxplot.
However, in some cases, we do not want to display the median line or want to add another metric line (e.g. mean) on the boxplot.
In matplotlib, you can remove the median line by passing the medianprops parameter with linewidth=0 value to the boxplot function.
The following example explains how to remove the median line from the boxplot using the matplotlib Python package.
Let’s create a random dataset for three groups using the rand function from NumPy,
# import packages
import numpy as np

data = np.random.rand(50, 3)
This dataset contains 50 observations with different means for three groups.
Create a boxplot using the boxplot function.
# import packages
import matplotlib.pyplot as plt

fig, ax = plt.subplots()
ax.boxplot(data)
plt.xlabel("groups")
plt.ylabel("values")
plt.show()

In the above boxplot, you can see that the median (orange line) is plotted by default.
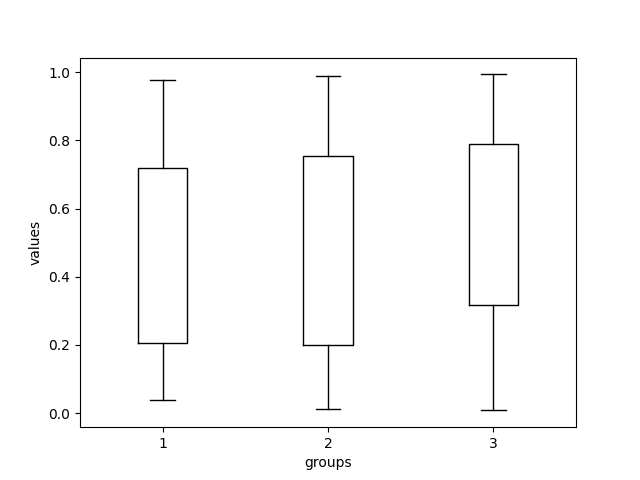
You can remove this median line by passing the medianprops parameter with linewidth=0 value to the boxplot function.
# import packages
import matplotlib.pyplot as plt

fig, ax = plt.subplots()
medianprops = dict(linewidth=0)
ax.boxplot(data, medianprops=medianprops)
plt.xlabel("groups")
plt.ylabel("values")
plt.show()
In the above boxplot, you can see that we have removed the median line from the boxplot. This helps to generate a cleaner boxplot and focus on other aspects of the data distribution.
