How to Show Mean on Boxplot Using Matplotlib
Boxplots are a great way to visualize the distribution (min, max, quartiles, and median) of a dataset. However, they do not display the mean of the dataset by default.
In Python matplotlib, you can use the showmeans parameter from the boxplot function to show the mean on the boxplot.
The following example explains how to plot a boxplot and show the mean on it using the matplotlib Python package.
Let’s create a random dataset for three groups using the rand function from NumPy,
# import packages
import numpy as np

data = np.random.rand(50, 3)
This dataset contains 50 observations with different means for three groups.
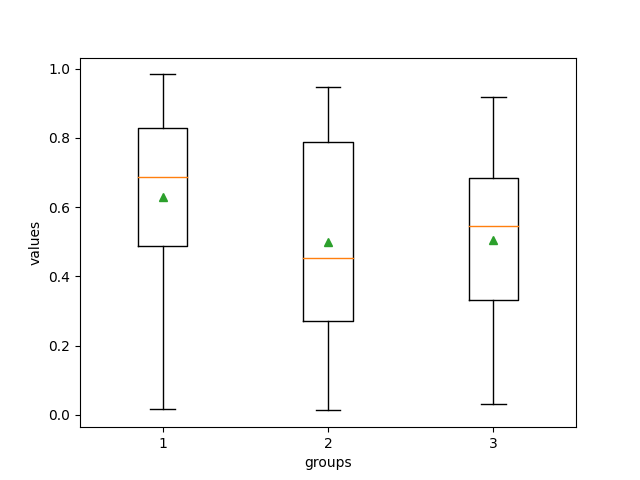
Create a boxplot using the boxplot function and show the mean value on the boxplot by passing the showmeans=True parameter.
# import packages
import matplotlib.pyplot as plt

fig, ax = plt.subplots()
ax.boxplot(data, showmeans=True)
plt.xlabel("groups")
plt.ylabel("values")
plt.show()

In the above boxplot, the green triangle at the boxplot represents the mean of the dataset. The default orange lines represent the median of the dataset.
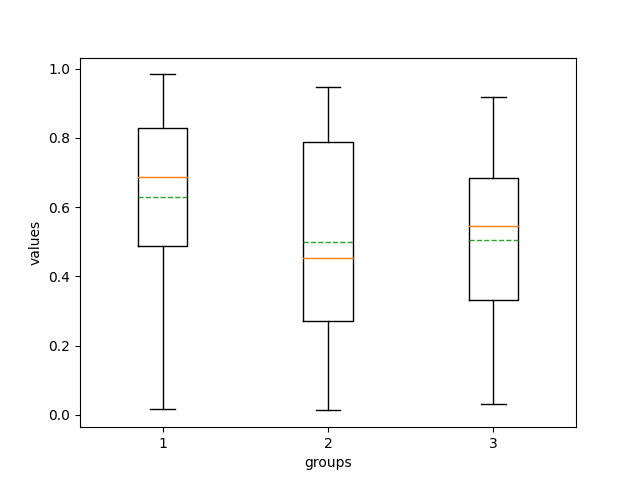
You can also add a line (similar to the median) for the mean on the boxplot instead of plotting triangle shapes.
# import packages
import matplotlib.pyplot as plt

fig, ax = plt.subplots()
ax.boxplot(data, showmeans=True, meanline=True)
plt.xlabel("groups")
plt.ylabel("values")
plt.show()
